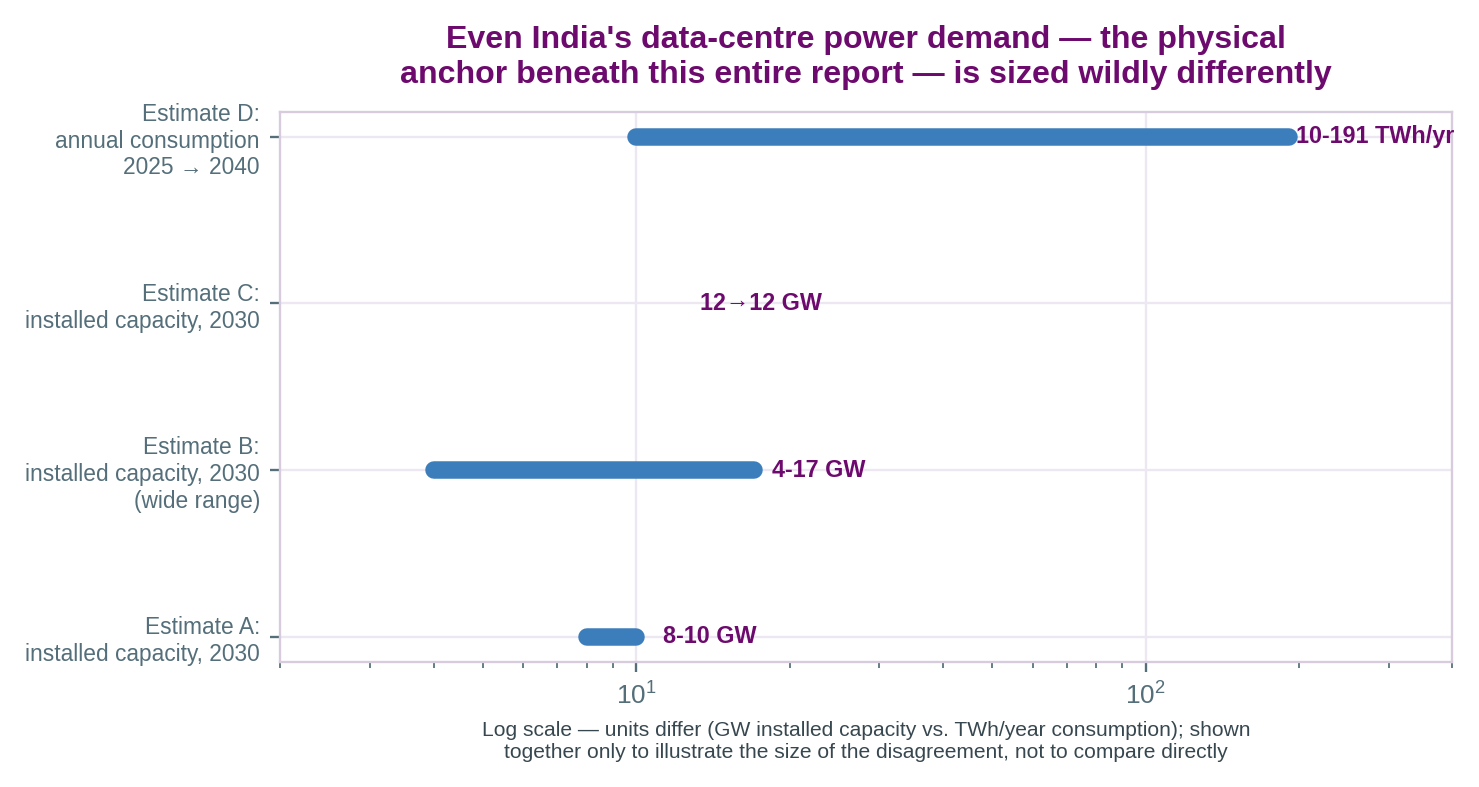
One enormous, well-documented global demand cycle is running underneath this entire report, and three India-specific policy cycles are running alongside it on independent timetables. Conflating "the AI opportunity" into one number — as most published India AI market-size estimates implicitly do — is the single easiest way to misread this sector.
| Demand cycle | Anchor buyer | What is actually driving it |
|---|---|---|
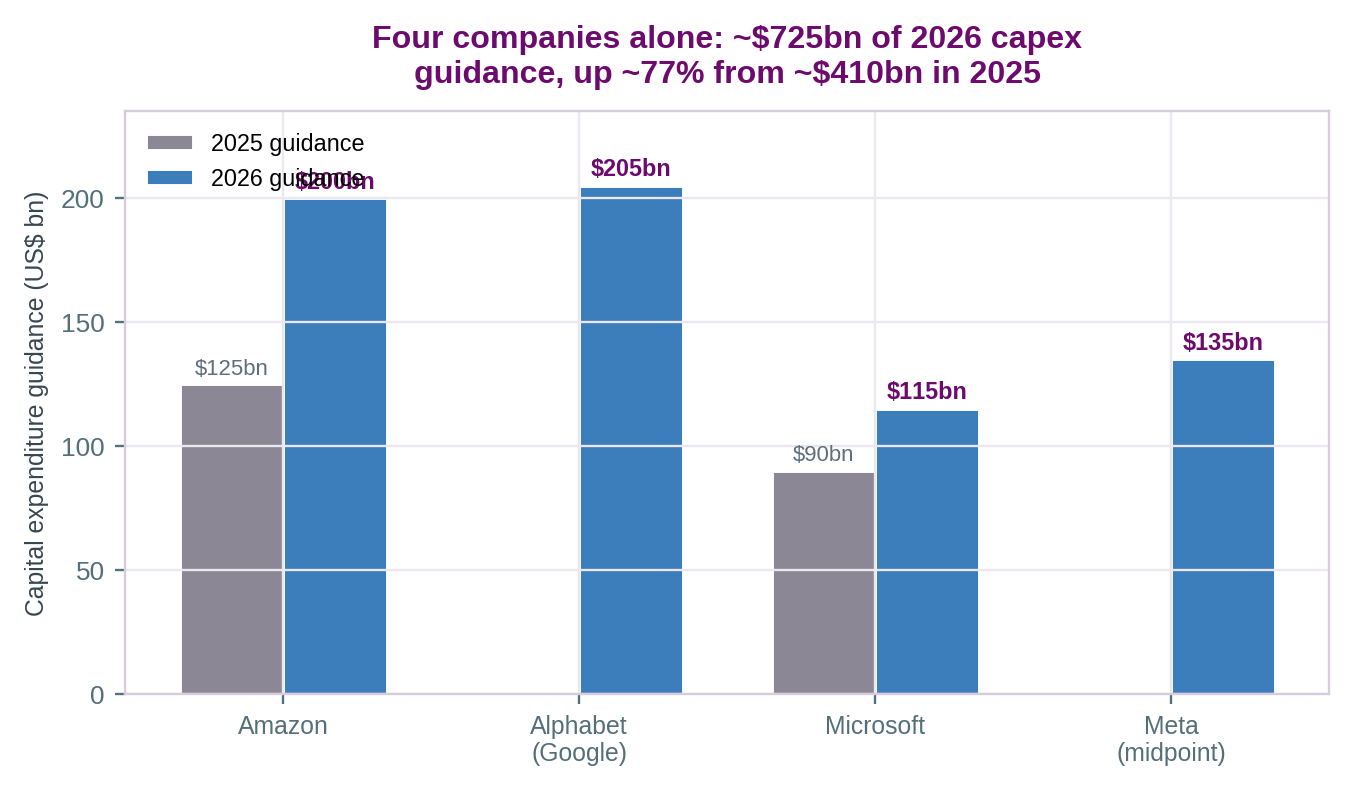
| 1. Global hyperscaler capex | Microsoft, Amazon, Google, Meta | Combined ~US$725bn 2026 capex guidance, up ~77% from ~US$410bn in 2025 (dated Feb-Aug 2026 disclosures) — the overwhelming majority earmarked for AI data centres, GPUs and power |
| 2. GPU/HBM physical scarcity | TSMC, Nvidia, SK Hynix, Samsung, Micron | CoWoS advanced-packaging capacity reported "sold out through 2026"; HBM production reported sold out through 2026-27 under multi-year supply agreements |
| 3. India semiconductor localisation | India Semiconductor Mission 2.0 | $13.5bn outlay (up from $8bn in ISM 1.0), 12-13 approved projects, three OSAT/ATMP facilities operational as of this report's research date (19 Sep 2026) |
| 4. Sovereign AI compute build-out | IndiaAI Mission | GPU access scaling from ~34,000 toward a 100,000-GPU public-access target by December 2026, at a subsidised ~₹65/GPU-hour |
| 5. India IT-hardware manufacturing | IT Hardware PLI 2.0 | ₹17,000cr incentive outlay over six years, explicitly covering server manufacturing alongside laptops and tablets |
Source: Dart Consultants, compiled from valueaddvc.com/cnbc.com/futurumgroup.com (hyperscaler capex), digitimes.com/tomshardware.com (CoWoS/HBM), ism.gov.in-linked press coverage (ISM 2.0), indiaai.gov.in-linked coverage (IndiaAI Mission), and india-briefing.com/pib.gov.in (PLI 2.0) — see Notes for full citation list.
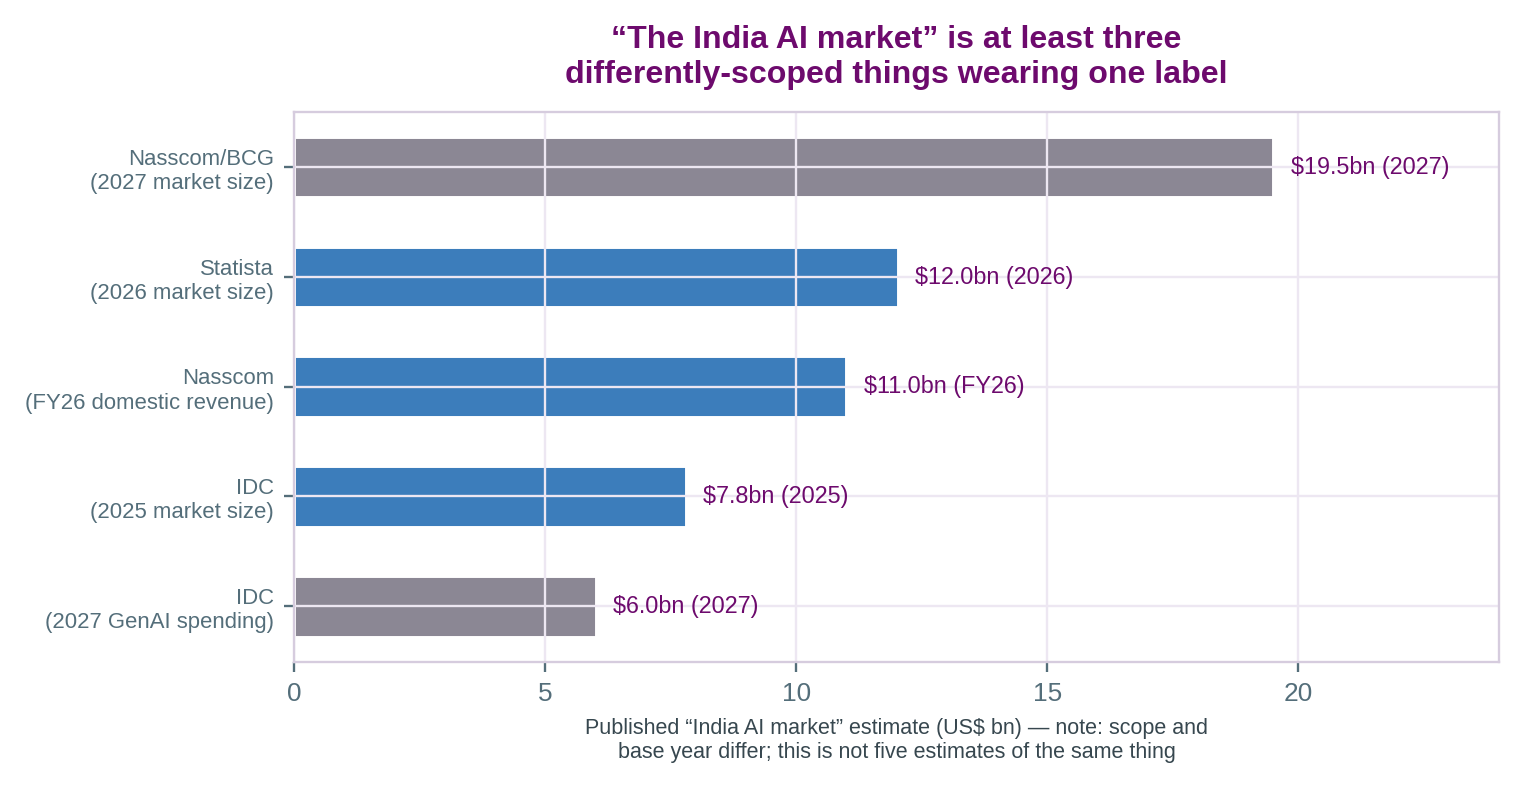
Every published "India AI market" figure in circulation uses a different scope, a different base year, and sometimes measures a different thing entirely — "market size," "spending," and "engineering R&D services revenue" are not interchangeable, yet headlines routinely swap between them. Five estimates for what is loosely called the same opportunity are shown below; they are not five estimates converging on one truth, and reporting only the largest or the newest without saying so would be exactly the failure mode this report exists to avoid.